Optimizing Fleet Management with Driver Scorecard Feature
Optimizing Fleet Management with Driver Scorecard Feature
Optimizing Fleet Management with Driver Scorecard Feature
Maven Machines
Ongoing
SaaS, B2B
Maven Machines
Ongoing
SaaS, B2B
Maven Machines
Ongoing
SaaS, B2B
Overview:
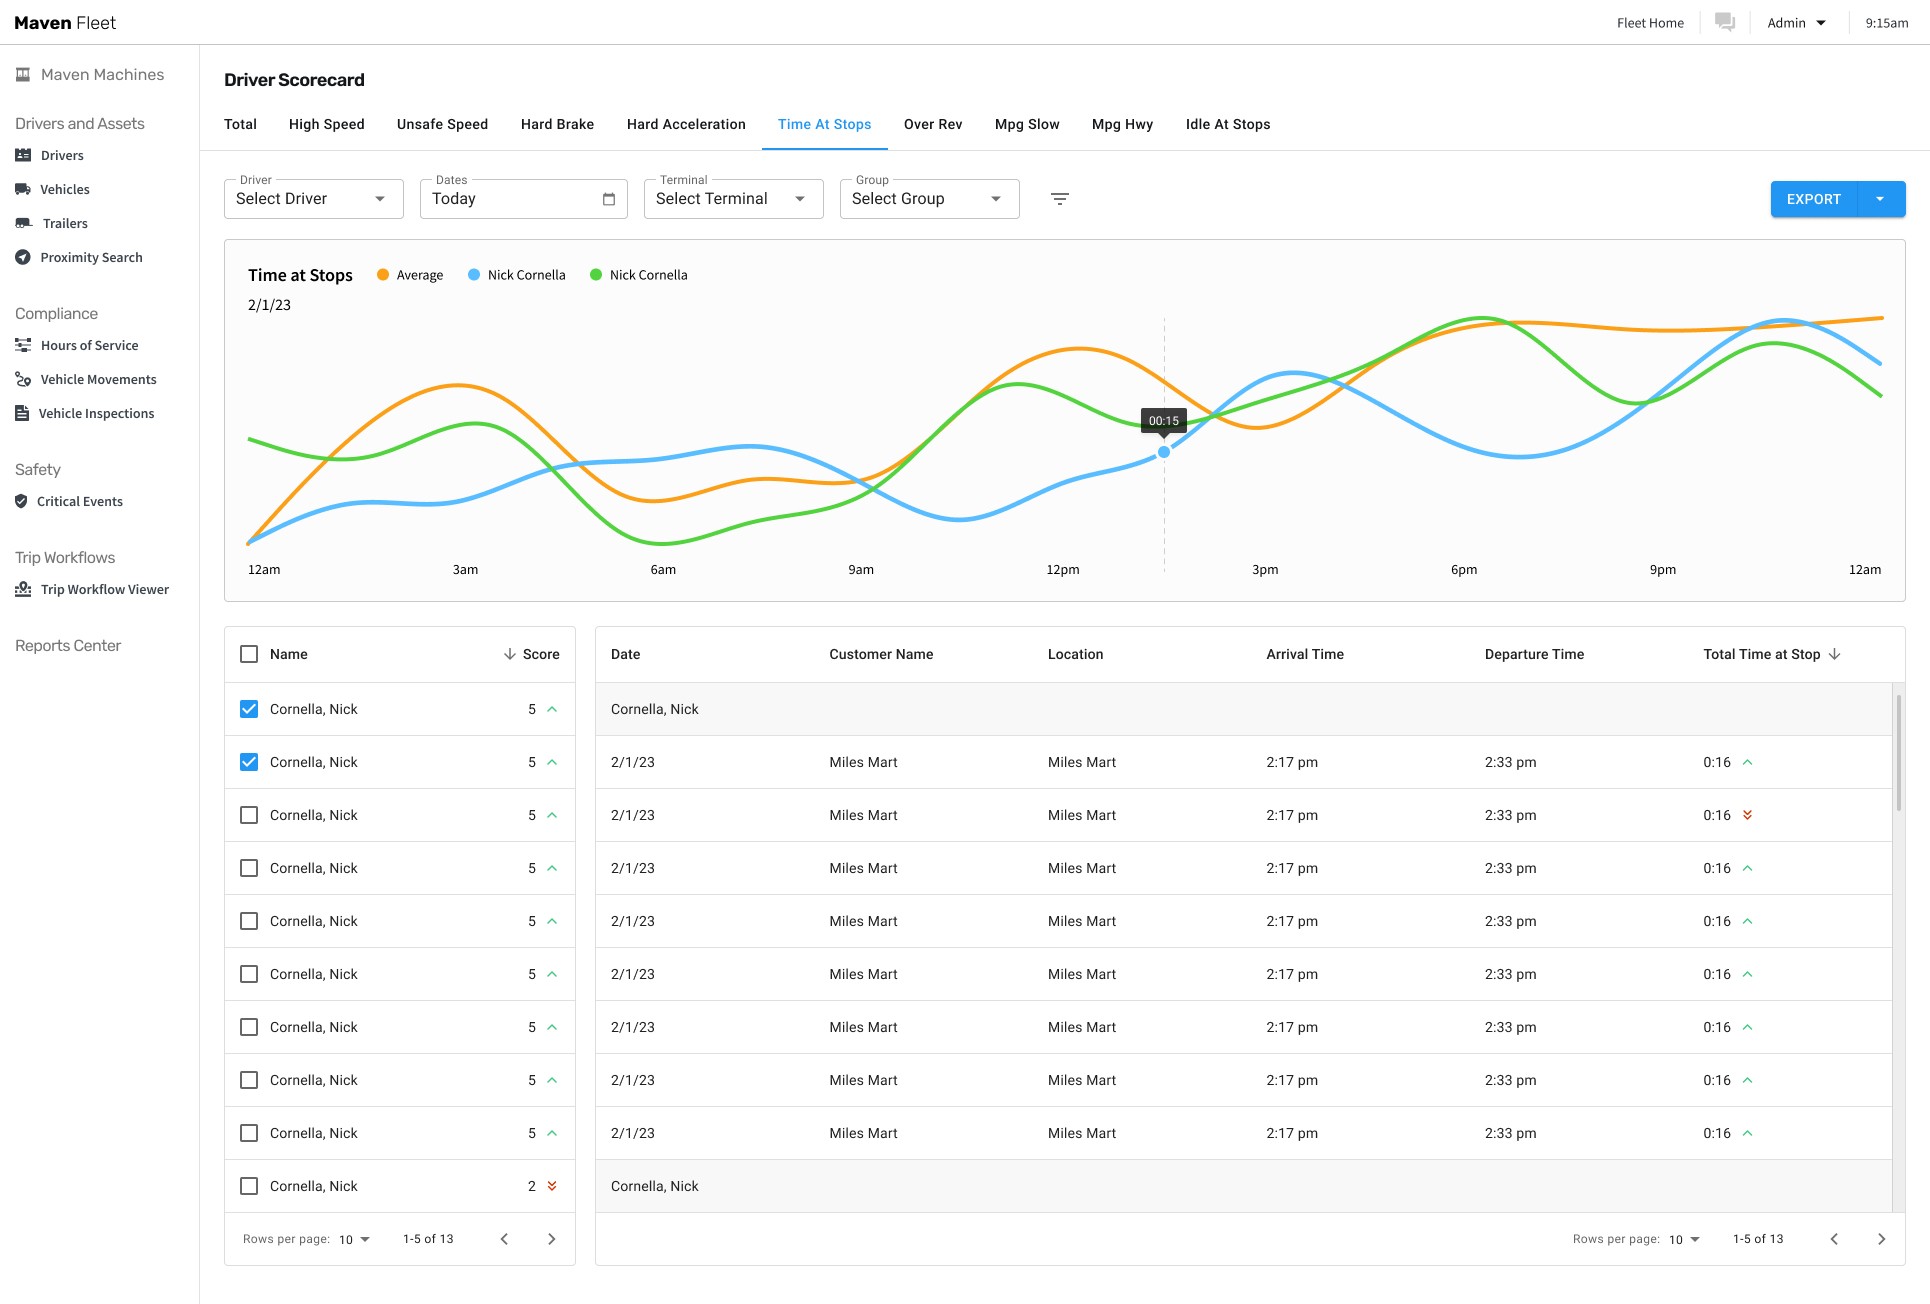
The Driver Scorecard, integrated within Maven's reporting center, provides comprehensive insights into driver and client performance metrics. This feature empowers managers and drivers to optimize fleet management and personal driving behaviors. Each driver receives a score based on performance across 9 key metrics, facilitating informed decision-making for both managers and clients.
Problem:
Limited Visibility: Lack of access to driver and client performance metrics hindered effective fleet management.
Productivity Enhancement: Absence of actionable insights prevented the identification of areas for productivity improvement.
Data Export Restrictions: Inability to export data for internal reporting purposes restricted data utilization.
Solution:
Enhanced Visibility: Increased accessibility to driver and client performance metrics for improved decision-making.
Data-Driven Productivity: Utilized a comprehensive dataset to identify opportunities for productivity enhancement.
Export Functionality: Implemented CSV and Excel export options to facilitate internal reporting and analysis.
Process:
Research & Define:
Conducted surveys to quantify data and gather insights into productivity improvement opportunities.
Interviewed users to understand current data utilization methods and pain points.
Utilized FigJam for whiteboarding sessions, hypothesis formulation, and idea generation.
Ideate:
Developed personas to ensure solutions catered to the needs of target users.
Created empathy maps and user flows to deepen understanding of user challenges and potential solutions.
Design:
Generated wireframes and prototypes, incorporating feedback from internal stakeholders to refine direction.
Adhered to design heuristics and principles throughout the design process.
Review:
Employed a qualitative approach for user testing, conducting moderated usability tests with 5 users.
Iteratively cycled through ideation, design, and testing phases to ensure the user experience effectively addressed user needs.
Outcomes:
Increased Visibility: Enhanced access to driver and client performance metrics resulted in 40% more informed decision-making.
Data-Driven Insights: Utilization of comprehensive dataset facilitated identification of productivity improvement opportunities, leading to a 30% increase in route efficiency.
Improved Reporting: CSV and Excel export functionality enabled seamless internal reporting and analysis, reducing reporting time by 50%.
Conclusion:
Through user-centric research, iterative design processes, and qualitative testing, the Driver Scorecard feature successfully addressed the challenges faced in fleet management. The project underscored the importance of data-driven decision-making and iterative refinement in delivering impactful solutions.
Next Steps:
Continued monitoring of user feedback and analytics to identify further optimization opportunities and enhance user satisfaction.
Key Takeaways:
User research is critical for understanding user needs and pain points.
Iterative design and testing are essential for refining user experiences.
Collaboration between stakeholders and design teams is key to project success.
Overview:
The Driver Scorecard, integrated within Maven's reporting center, provides comprehensive insights into driver and client performance metrics. This feature empowers managers and drivers to optimize fleet management and personal driving behaviors. Each driver receives a score based on performance across 9 key metrics, facilitating informed decision-making for both managers and clients.
Problem:
Limited Visibility: Lack of access to driver and client performance metrics hindered effective fleet management.
Productivity Enhancement: Absence of actionable insights prevented the identification of areas for productivity improvement.
Data Export Restrictions: Inability to export data for internal reporting purposes restricted data utilization.
Solution:
Enhanced Visibility: Increased accessibility to driver and client performance metrics for improved decision-making.
Data-Driven Productivity: Utilized a comprehensive dataset to identify opportunities for productivity enhancement.
Export Functionality: Implemented CSV and Excel export options to facilitate internal reporting and analysis.
Process:
Research & Define:
Conducted surveys to quantify data and gather insights into productivity improvement opportunities.
Interviewed users to understand current data utilization methods and pain points.
Utilized FigJam for whiteboarding sessions, hypothesis formulation, and idea generation.
Ideate:
Developed personas to ensure solutions catered to the needs of target users.
Created empathy maps and user flows to deepen understanding of user challenges and potential solutions.
Design:
Generated wireframes and prototypes, incorporating feedback from internal stakeholders to refine direction.
Adhered to design heuristics and principles throughout the design process.
Review:
Employed a qualitative approach for user testing, conducting moderated usability tests with 5 users.
Iteratively cycled through ideation, design, and testing phases to ensure the user experience effectively addressed user needs.
Outcomes:
Increased Visibility: Enhanced access to driver and client performance metrics resulted in 40% more informed decision-making.
Data-Driven Insights: Utilization of comprehensive dataset facilitated identification of productivity improvement opportunities, leading to a 30% increase in route efficiency.
Improved Reporting: CSV and Excel export functionality enabled seamless internal reporting and analysis, reducing reporting time by 50%.
Conclusion:
Through user-centric research, iterative design processes, and qualitative testing, the Driver Scorecard feature successfully addressed the challenges faced in fleet management. The project underscored the importance of data-driven decision-making and iterative refinement in delivering impactful solutions.
Next Steps:
Continued monitoring of user feedback and analytics to identify further optimization opportunities and enhance user satisfaction.
Key Takeaways:
User research is critical for understanding user needs and pain points.
Iterative design and testing are essential for refining user experiences.
Collaboration between stakeholders and design teams is key to project success.
Other Projects

© Copyright 2023. All rights Reserved.
© Copyright 2023. All rights Reserved.
