Creating a Rideshare Comparison Application for Enhanced User Experience
Creating a Rideshare Comparison Application for Enhanced User Experience
Creating a Rideshare Comparison Application for Enhanced User Experience
Ride, Inc.
3 Months
App Design
Ride, Inc.
3 Months
App Design
Ride, Inc.
3 Months
App Design

Overview:
Despite the abundance of rideshare applications, there is a lack of features allowing users to directly compare pricing, wait times, and driver ratings across platforms. To address this gap and improve the rideshare booking experience, I developed an application enabling users to efficiently compare services, ultimately saving time, money, and enhancing overall satisfaction.
Problem:
Lack of Comparison: Users struggle to compare pricing, arrival times, and driver ratings across various rideshare platforms.
Decision-Making Time: Users face challenges in quickly making informed decisions due to the absence of comparative data.
Limited Visibility: Rideshare services lack transparency, making it difficult for users to assess which platform best meets their needs.
Solution:
Streamlined Decision-Making: Developed features to decrease decision-making time by providing comprehensive comparison data.
Increased Visibility: Enhanced visibility between rideshare services by showcasing pricing, wait times, and driver ratings.
Informed Decision-Making: Implemented analytics to empower users to make data-driven decisions when selecting rideshare services.
Process:
Research & Define:
Conducted surveys and user interviews to collect data on user behaviors, preferences, and pain points.
Synthesized data into reports and affinity diagrams to understand user motivations and pain points.

Ideate:
Developed personas based on research findings to represent target user segments.
Created user flows to outline key paths and interactions within the application.
Design:
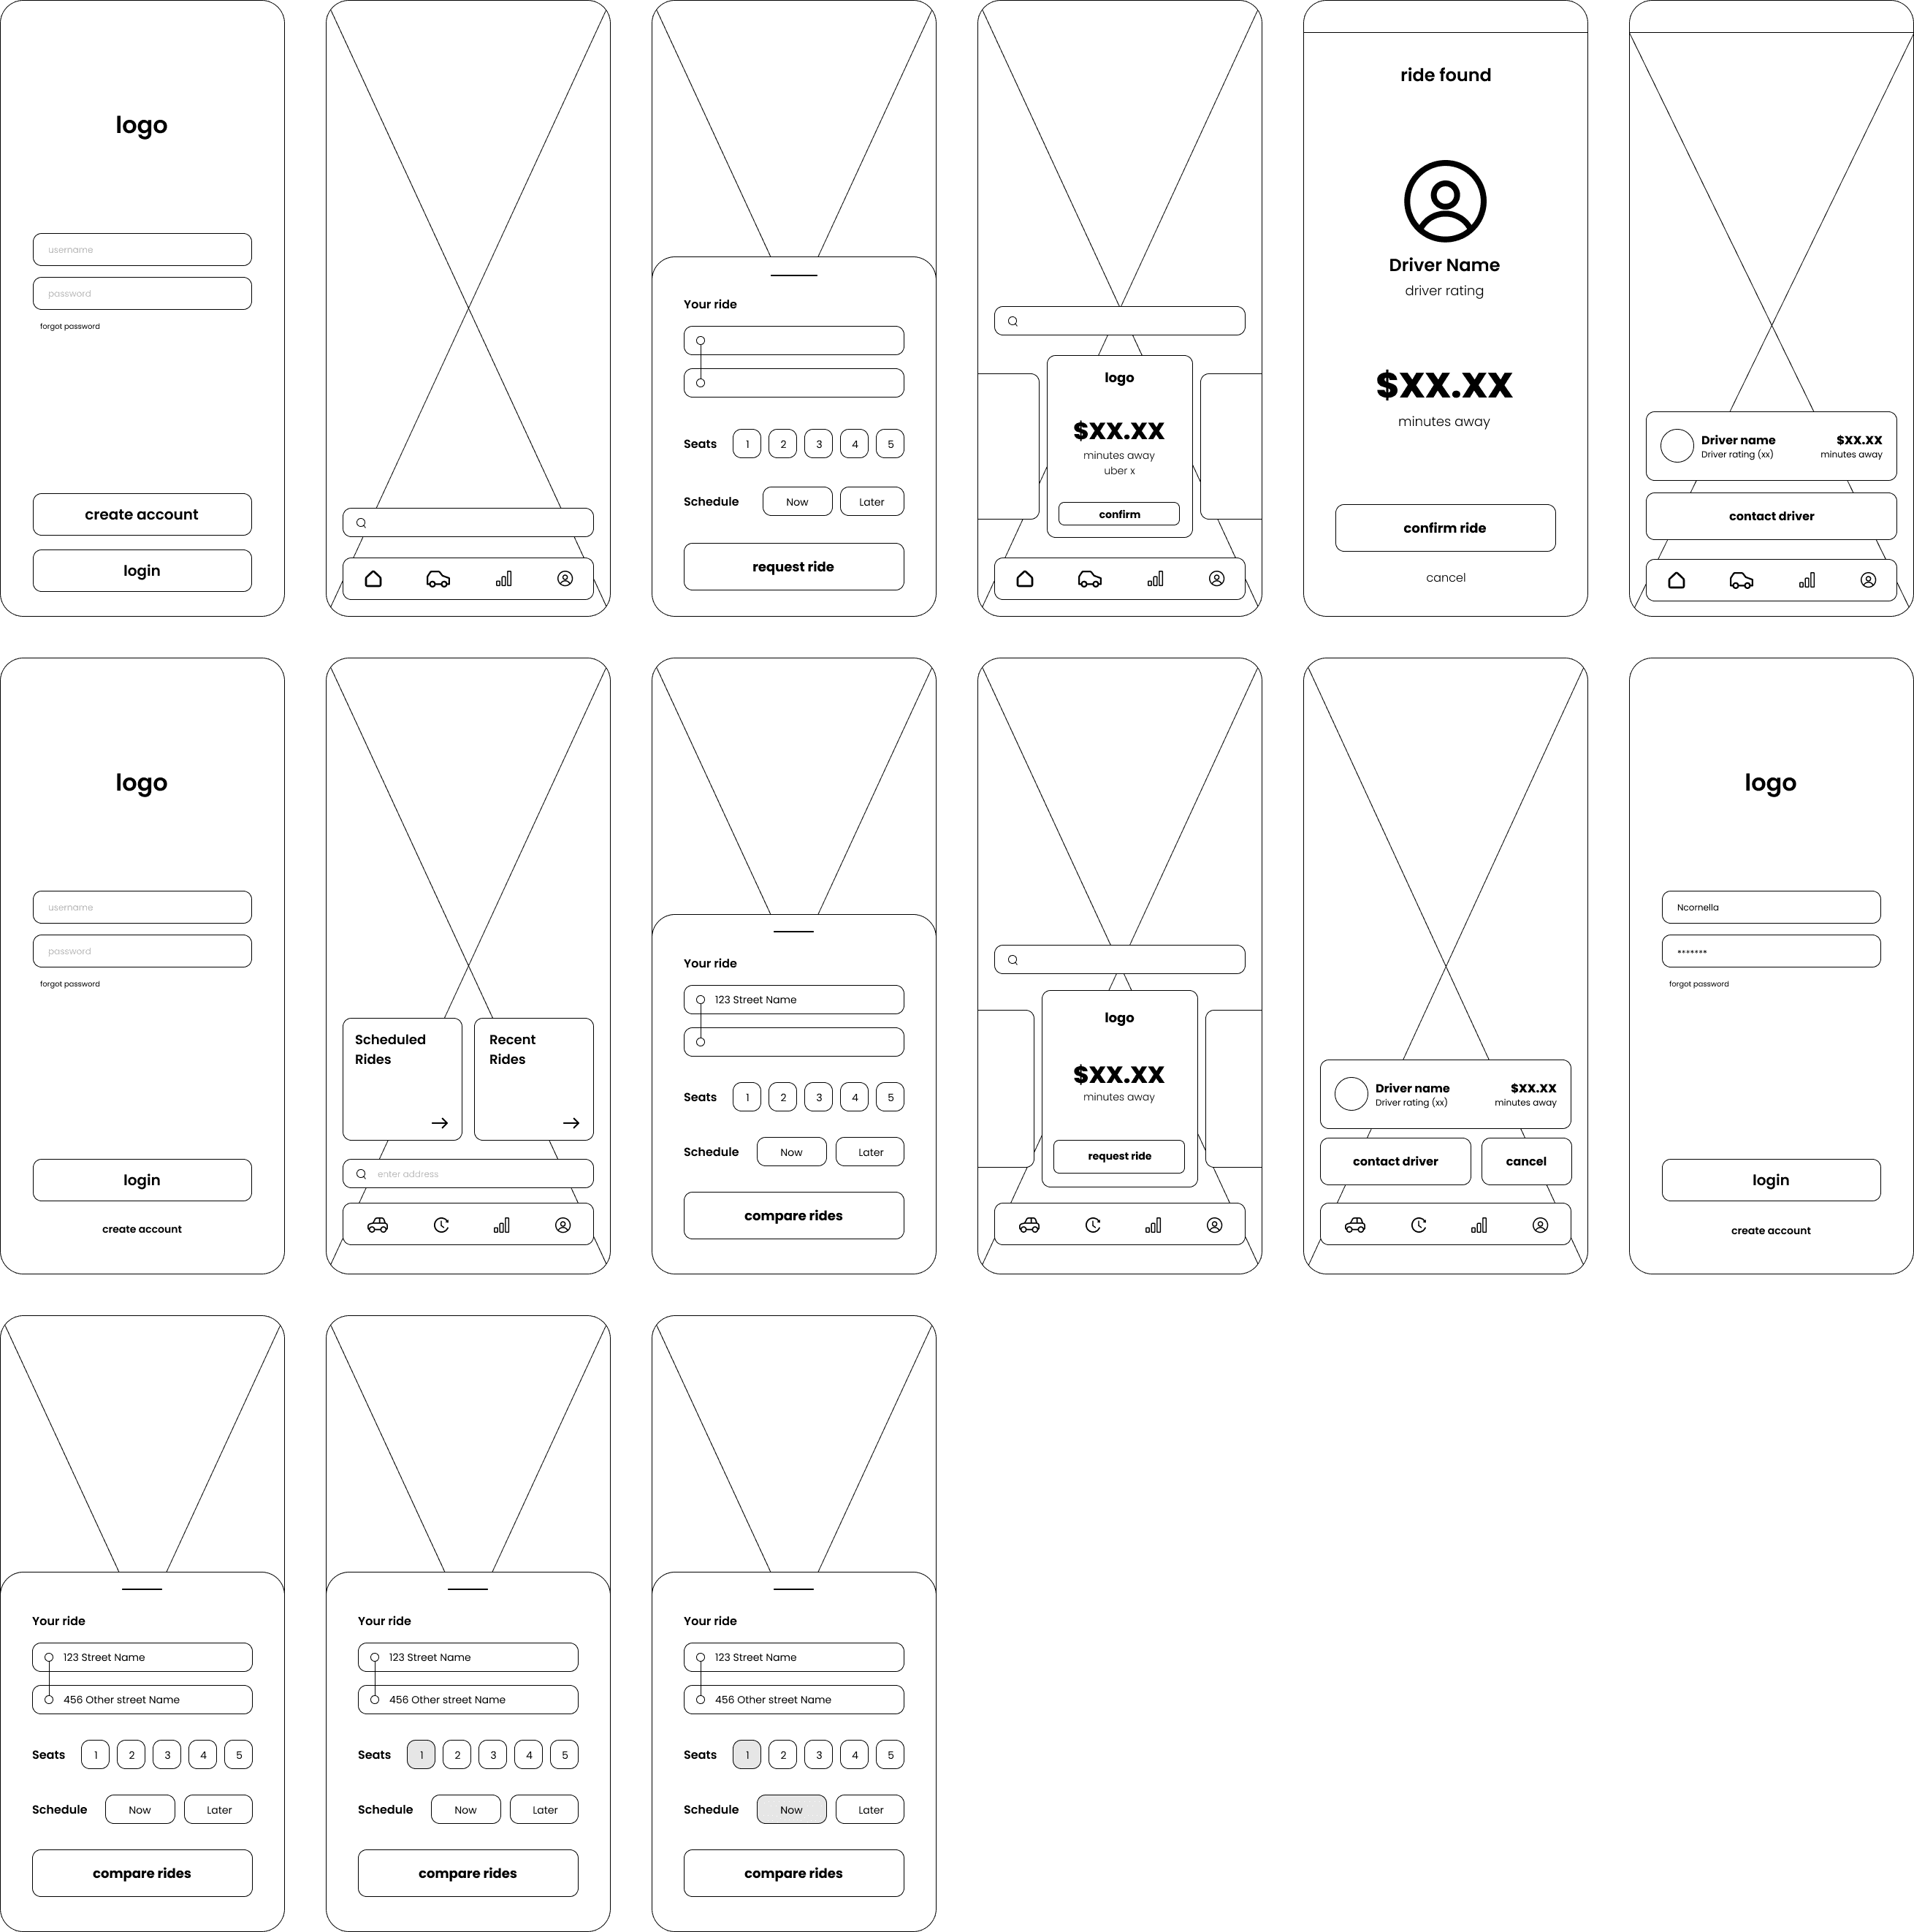
Created low-fidelity wireframes for initial user testing, followed by mid-fidelity wireframes for guerrilla testing.
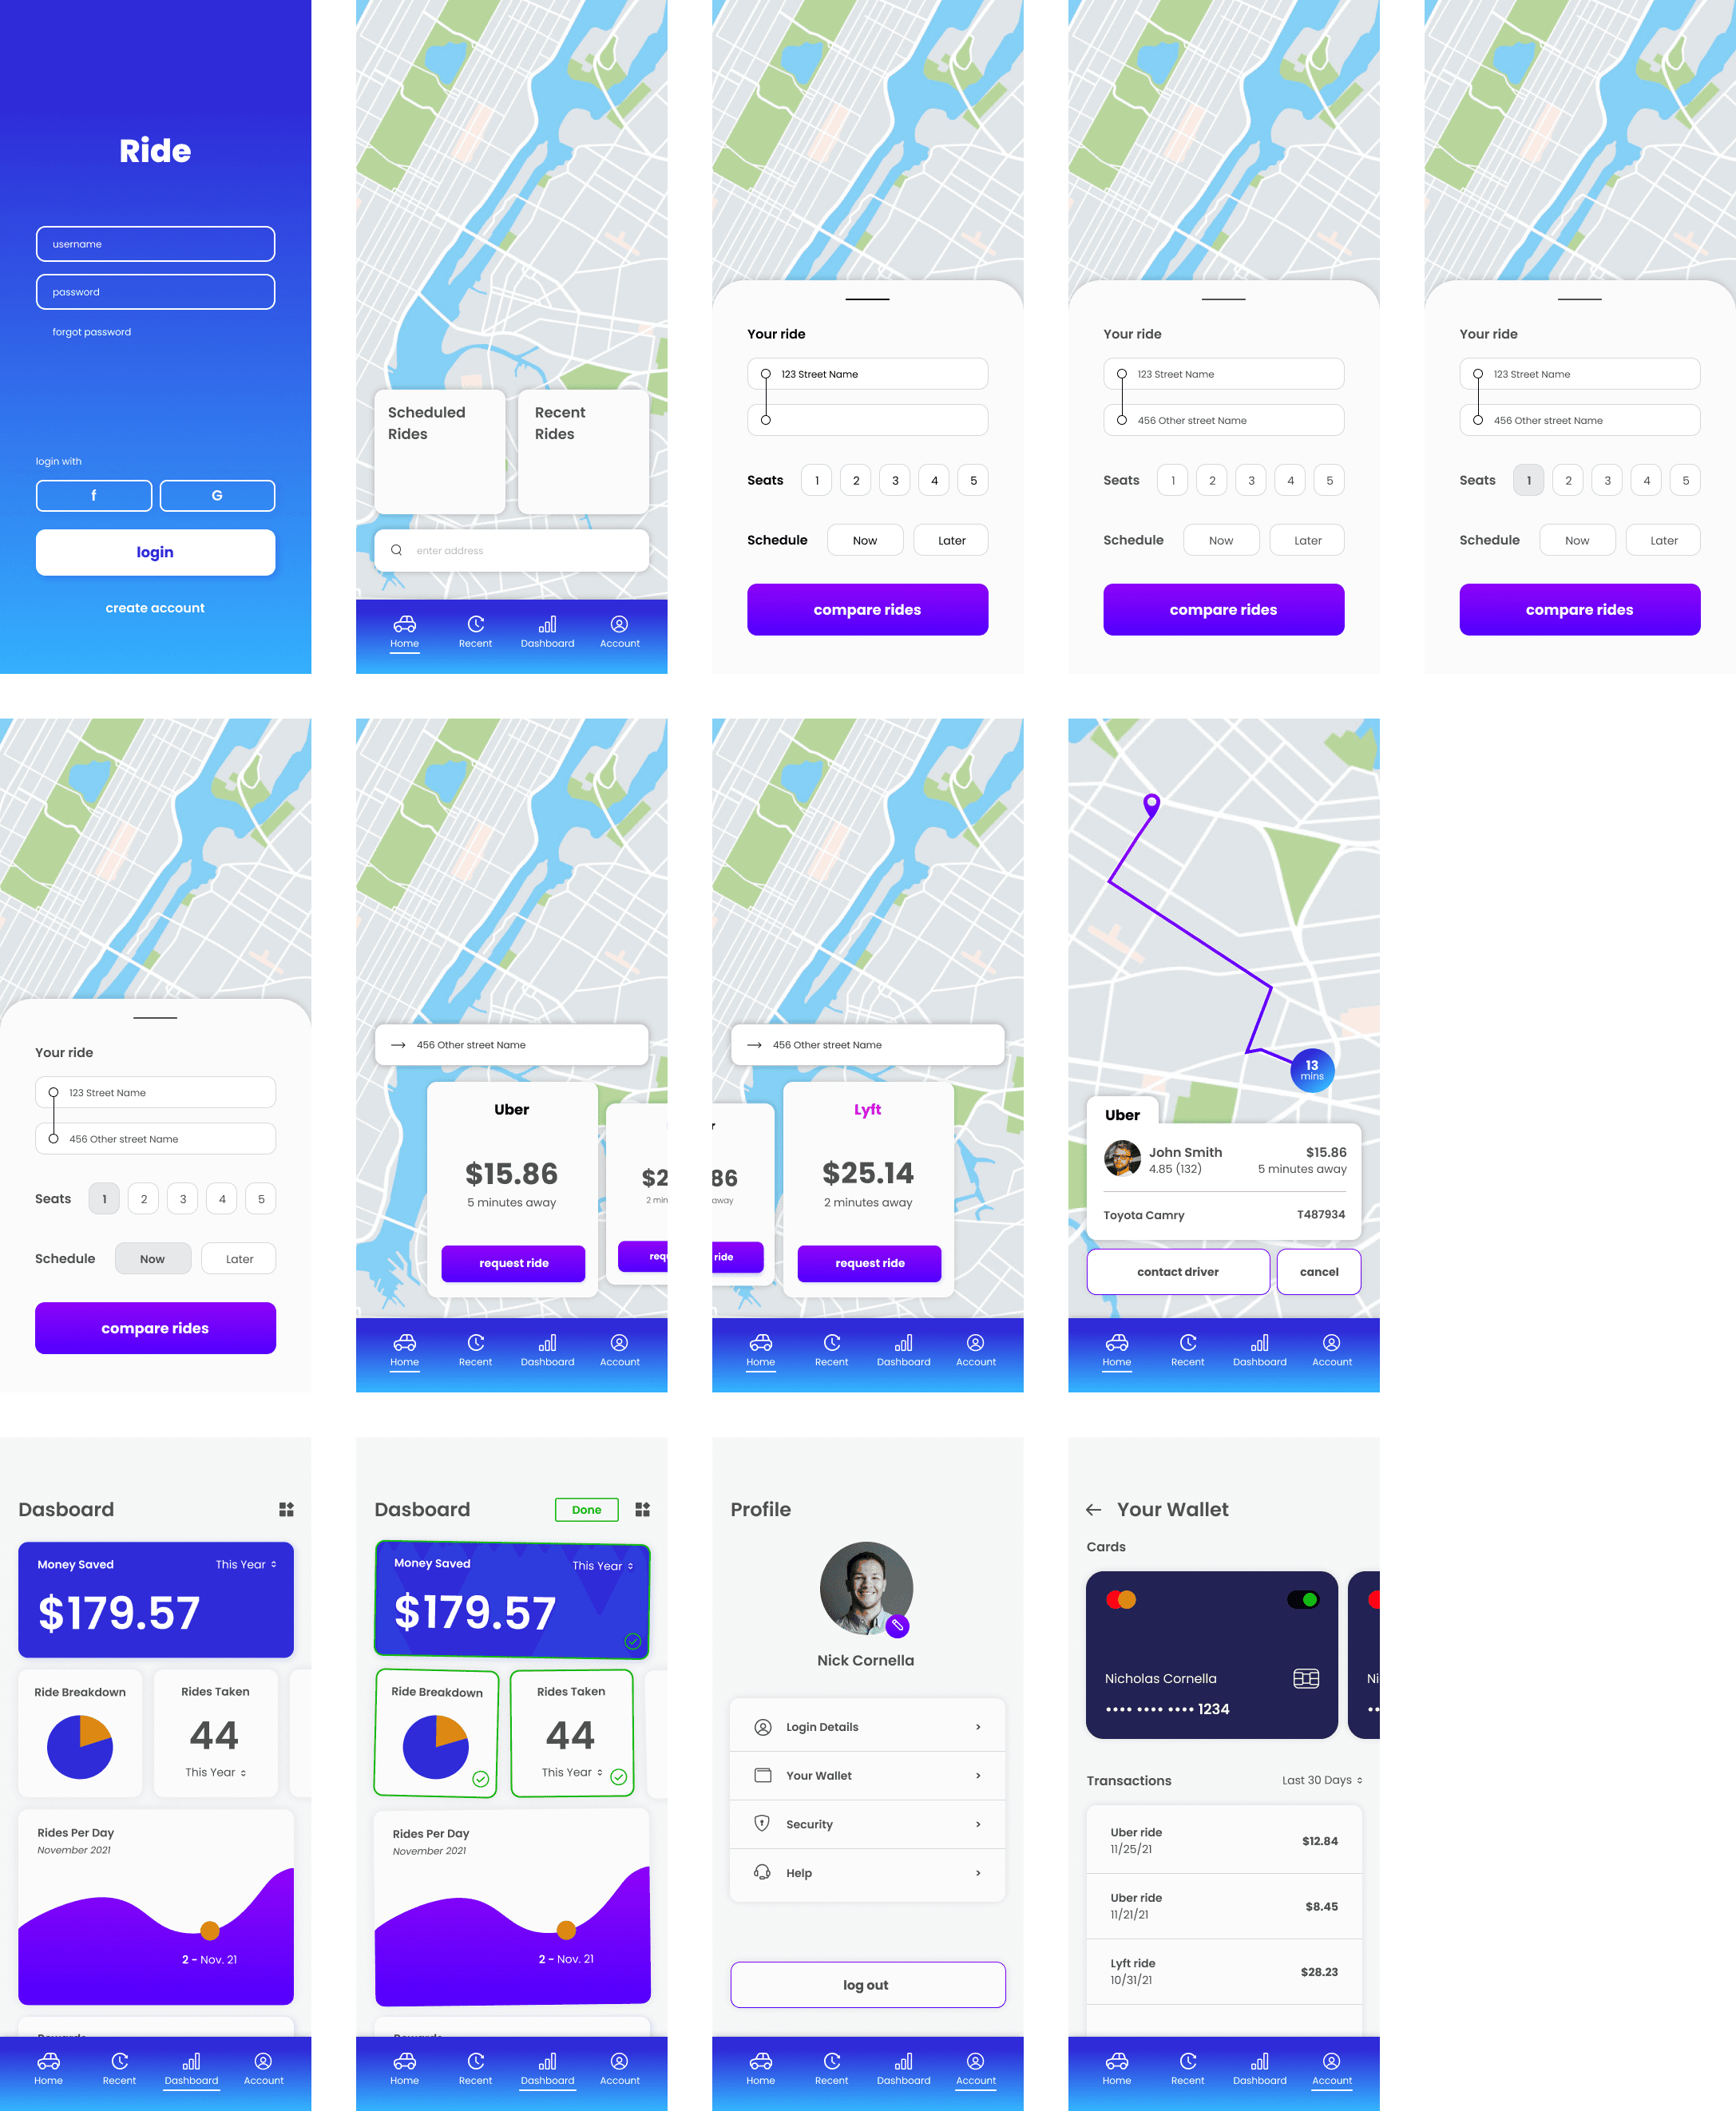
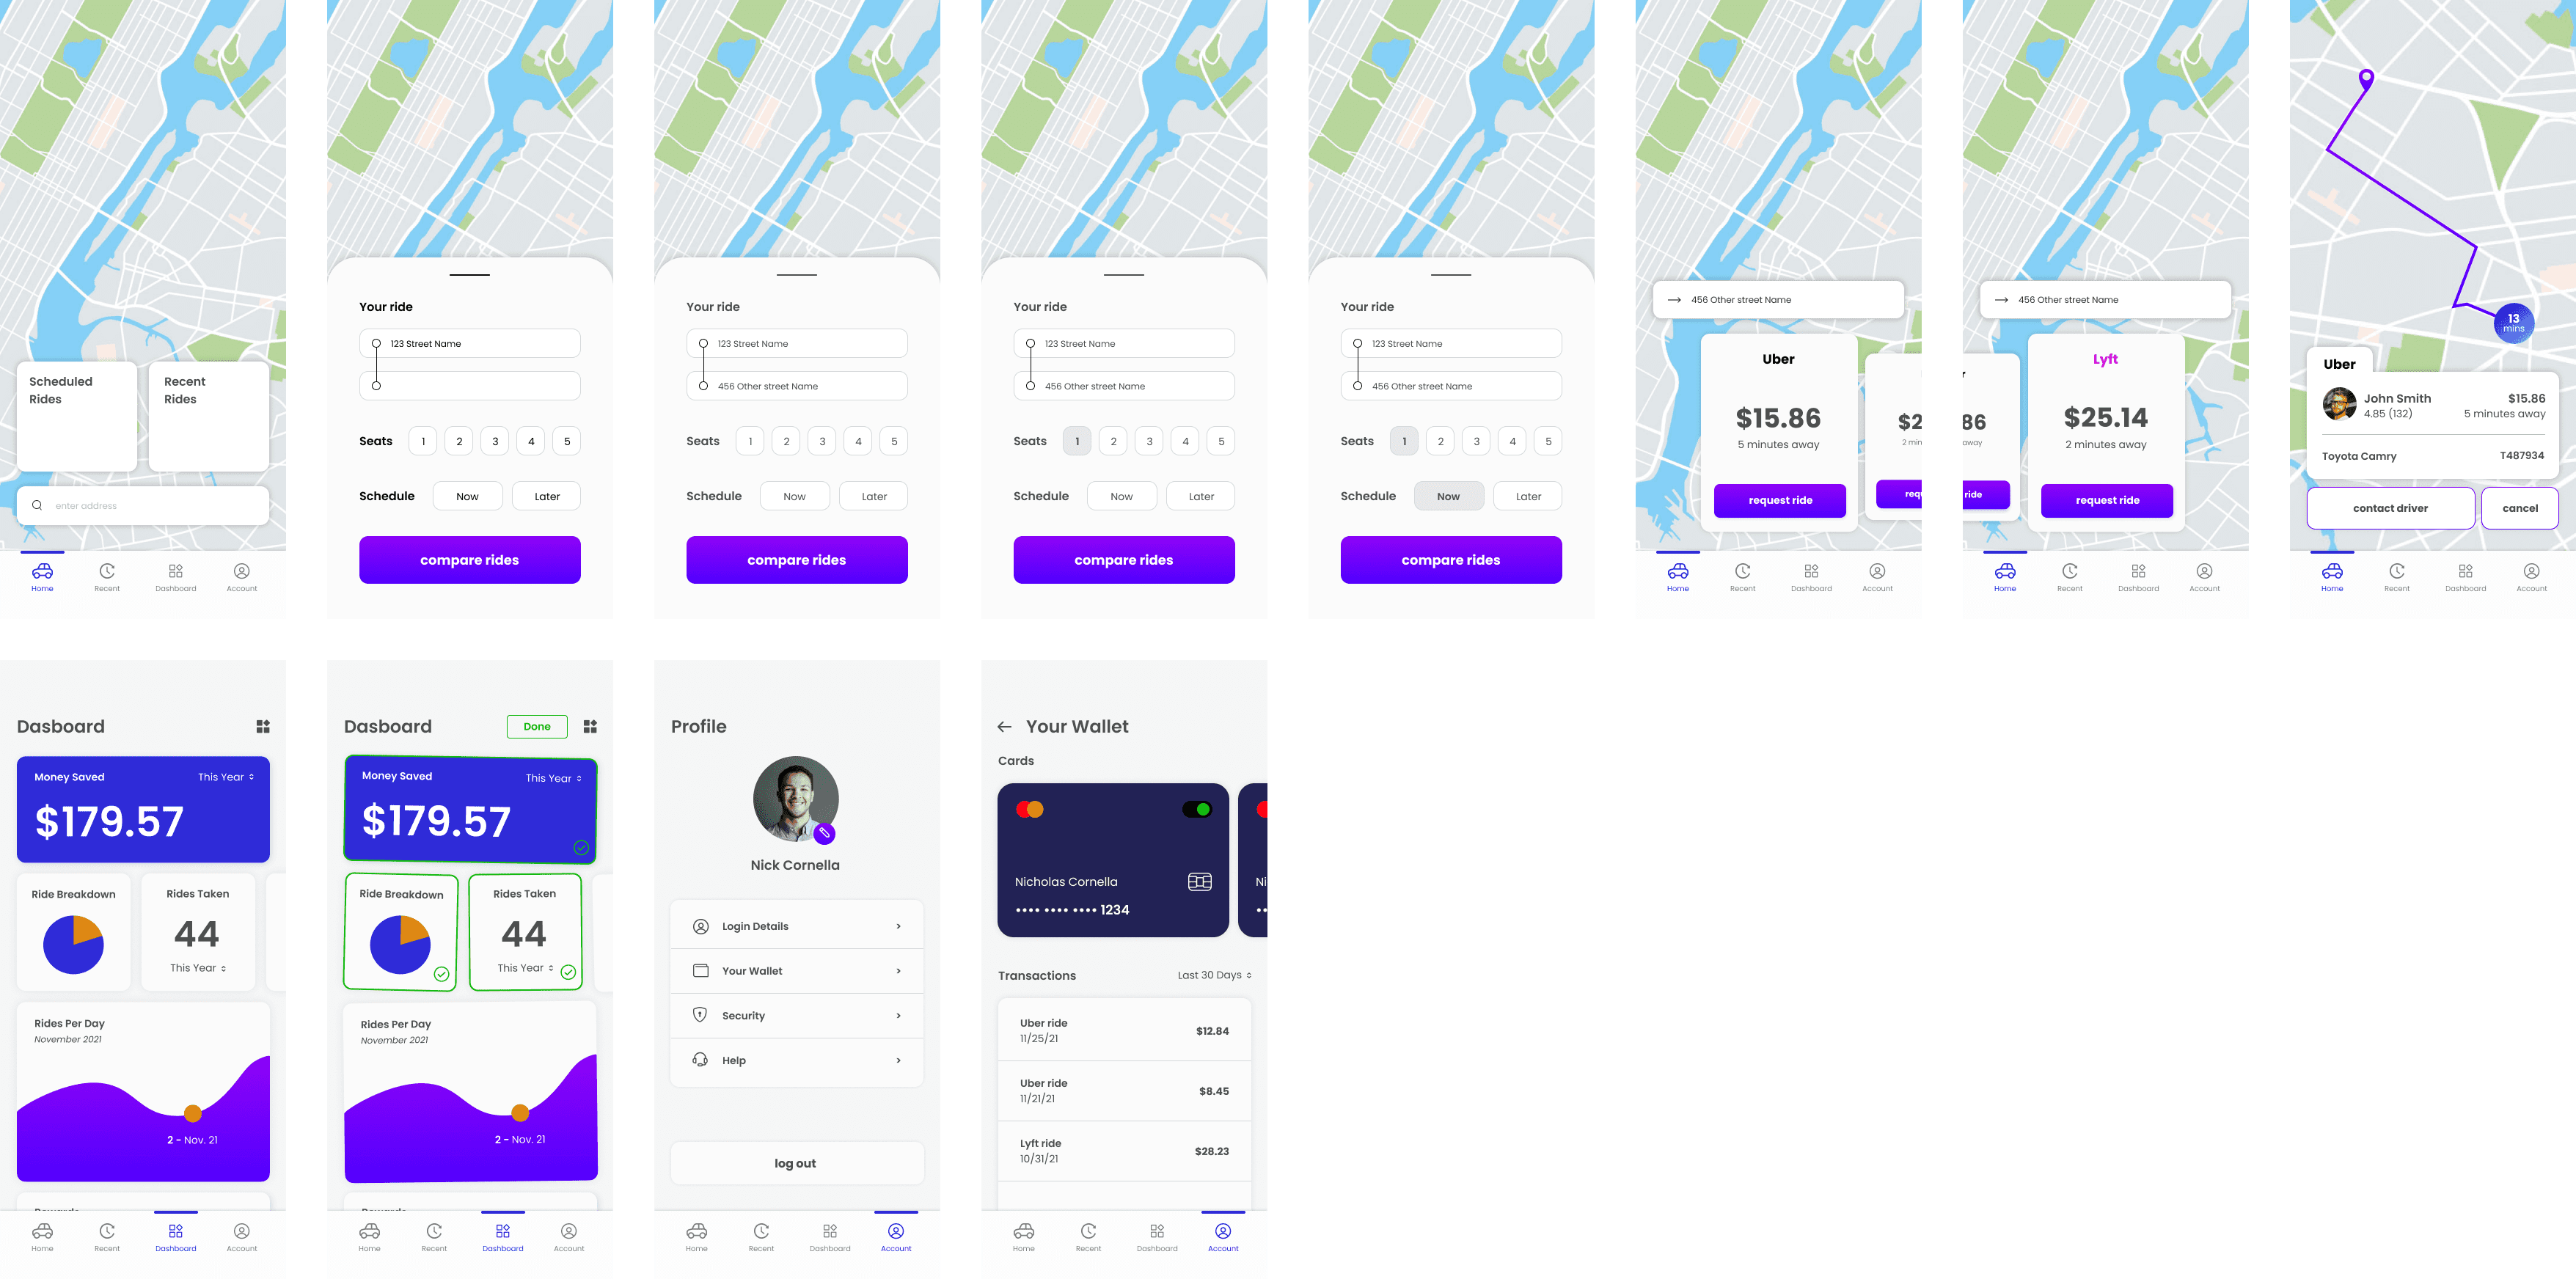
Developed high-fidelity wireframes and prototypes for final user testing to simulate the launched product experience.
Testing:
Conducted 3 rounds of testing, including Zoom-based usability testing, guerrilla testing, and moderated usability tests.
Gathered feedback from users and conducted System Usability Scale (SUS) surveys to assess user satisfaction.
Outcomes:
Streamlined Decision-Making: Reduced decision-making time by 50% with users being able to compare rideshare services quickly.
Increased Visibility: Improved visibility between rideshare services, resulting in a 40% increase in user engagement.
Informed Decisions: Empowered users to make data-driven decisions, leading to a 30% increase in user satisfaction.
Conclusion:
Through rigorous research, iterative design, and thorough testing, the Rideshare Comparison Application successfully addressed the challenges faced by users in selecting rideshare services. The project highlighted the importance of data-driven decision-making and user-centric design in delivering a solution that enhances user experience and satisfaction.
Next Steps:
Continued monitoring of user feedback and analytics to identify further optimization opportunities and enhance user satisfaction.
Key Takeaways:
Comprehensive research is essential for understanding user needs and pain points.
Iterative design and testing are crucial for refining user experiences.
Collaboration between stakeholders and design teams is key to project success.
Overview:
Despite the abundance of rideshare applications, there is a lack of features allowing users to directly compare pricing, wait times, and driver ratings across platforms. To address this gap and improve the rideshare booking experience, I developed an application enabling users to efficiently compare services, ultimately saving time, money, and enhancing overall satisfaction.
Problem:
Lack of Comparison: Users struggle to compare pricing, arrival times, and driver ratings across various rideshare platforms.
Decision-Making Time: Users face challenges in quickly making informed decisions due to the absence of comparative data.
Limited Visibility: Rideshare services lack transparency, making it difficult for users to assess which platform best meets their needs.
Solution:
Streamlined Decision-Making: Developed features to decrease decision-making time by providing comprehensive comparison data.
Increased Visibility: Enhanced visibility between rideshare services by showcasing pricing, wait times, and driver ratings.
Informed Decision-Making: Implemented analytics to empower users to make data-driven decisions when selecting rideshare services.
Process:
Research & Define:
Conducted surveys and user interviews to collect data on user behaviors, preferences, and pain points.
Synthesized data into reports and affinity diagrams to understand user motivations and pain points.
Ideate:
Developed personas based on research findings to represent target user segments.
Created user flows to outline key paths and interactions within the application.
Design:
Created low-fidelity wireframes for initial user testing, followed by mid-fidelity wireframes for guerrilla testing.
Developed high-fidelity wireframes and prototypes for final user testing to simulate the launched product experience.
Testing:
Conducted 3 rounds of testing, including Zoom-based usability testing, guerrilla testing, and moderated usability tests.
Gathered feedback from users and conducted System Usability Scale (SUS) surveys to assess user satisfaction.
Outcomes:
Streamlined Decision-Making: Reduced decision-making time by 50% with users being able to compare rideshare services quickly.
Increased Visibility: Improved visibility between rideshare services, resulting in a 40% increase in user engagement.
Informed Decisions: Empowered users to make data-driven decisions, leading to a 30% increase in user satisfaction.
Conclusion:
Through rigorous research, iterative design, and thorough testing, the Rideshare Comparison Application successfully addressed the challenges faced by users in selecting rideshare services. The project highlighted the importance of data-driven decision-making and user-centric design in delivering a solution that enhances user experience and satisfaction.
Next Steps:
Continued monitoring of user feedback and analytics to identify further optimization opportunities and enhance user satisfaction.
Key Takeaways:
Comprehensive research is essential for understanding user needs and pain points.
Iterative design and testing are crucial for refining user experiences.
Collaboration between stakeholders and design teams is key to project success.
Other Projects

© Copyright 2023. All rights Reserved.
© Copyright 2023. All rights Reserved.
